
Statistics at a Glance
At a Glance
| Year | Rate of New Cases — SEER 8 | Rate of New Cases — SEER 12 | Death Rate — U.S. | 5-Year Relative Survival — SEER 8 | ||||
|---|---|---|---|---|---|---|---|---|
| Observed | Modeled Trend | Observed | Modeled Trend | Observed | Modeled Trend | Observed | Modeled Trend | |
| 1975 | 2.24 | 2.51 | - | - | 0.93 | 0.91 | 62.83% | 56.71% |
| 1976 | 2.35 | 2.53 | - | - | 0.91 | 0.90 | 59.99% | 57.58% |
| 1977 | 2.74 | 2.55 | - | - | 0.92 | 0.89 | 55.62% | 58.45% |
| 1978 | 2.57 | 2.57 | - | - | 0.80 | 0.88 | 55.01% | 59.30% |
| 1979 | 2.53 | 2.59 | - | - | 0.86 | 0.87 | 59.98% | 60.14% |
| 1980 | 2.65 | 2.61 | - | - | 0.83 | 0.86 | 61.21% | 60.97% |
| 1981 | 2.28 | 2.63 | - | - | 0.82 | 0.85 | 62.83% | 61.79% |
| 1982 | 2.33 | 2.65 | - | - | 0.91 | 0.84 | 56.70% | 62.59% |
| 1983 | 2.34 | 2.67 | - | - | 0.82 | 0.83 | 63.95% | 63.39% |
| 1984 | 2.45 | 2.70 | - | - | 0.79 | 0.82 | 72.05% | 64.17% |
| 1985 | 2.46 | 2.72 | - | - | 0.79 | 0.81 | 62.83% | 64.94% |
| 1986 | 3.33 | 2.74 | - | - | 0.81 | 0.80 | 63.91% | 65.70% |
| 1987 | 3.05 | 2.76 | - | - | 0.71 | 0.79 | 72.16% | 66.45% |
| 1988 | 2.98 | 2.78 | - | - | 0.80 | 0.78 | 65.63% | 67.19% |
| 1989 | 2.87 | 2.81 | - | - | 0.80 | 0.77 | 62.25% | 67.91% |
| 1990 | 3.14 | 2.83 | - | - | 0.79 | 0.76 | 63.67% | 68.62% |
| 1991 | 2.98 | 2.85 | - | - | 0.80 | 0.75 | 68.47% | 69.32% |
| 1992 | 3.18 | 2.88 | 3.06 | 2.82 | 0.74 | 0.75 | 67.59% | 70.01% |
| 1993 | 2.90 | 2.90 | 2.79 | 2.83 | 0.77 | 0.74 | 66.42% | 70.68% |
| 1994 | 2.84 | 2.92 | 2.69 | 2.85 | 0.73 | 0.73 | 77.86% | 71.35% |
| 1995 | 3.05 | 2.95 | 2.75 | 2.86 | 0.68 | 0.72 | 72.31% | 72.00% |
| 1996 | 2.98 | 2.97 | 2.79 | 2.87 | 0.74 | 0.71 | 76.58% | 72.64% |
| 1997 | 2.62 | 2.99 | 2.64 | 2.88 | 0.69 | 0.70 | 77.48% | 73.27% |
| 1998 | 2.87 | 3.02 | 2.80 | 2.89 | 0.68 | 0.70 | 77.08% | 73.88% |
| 1999 | 3.14 | 3.04 | 2.91 | 2.90 | 0.68 | 0.69 | 72.14% | 74.49% |
| 2000 | 3.15 | 3.07 | 2.81 | 2.92 | 0.68 | 0.68 | 73.88% | 75.08% |
| 2001 | 3.56 | 3.09 | 3.20 | 2.93 | 0.64 | 0.68 | 77.12% | 75.66% |
| 2002 | 3.48 | 3.12 | 3.13 | 2.94 | 0.71 | 0.68 | 74.68% | 76.23% |
| 2003 | 2.98 | 3.14 | 3.00 | 2.95 | 0.71 | 0.67 | 77.41% | 76.79% |
| 2004 | 3.11 | 3.17 | 3.05 | 2.96 | 0.68 | 0.67 | 73.43% | 76.81% |
| 2005 | 3.15 | 3.19 | 3.04 | 2.98 | 0.67 | 0.67 | 78.61% | 76.83% |
| 2006 | 2.80 | 3.22 | 2.76 | 2.99 | 0.64 | 0.67 | 79.35% | 76.85% |
| 2007 | 3.24 | 3.25 | 3.09 | 3.00 | 0.64 | 0.66 | 72.73% | 76.87% |
| 2008 | 3.25 | 3.27 | 2.97 | 3.01 | 0.65 | 0.66 | 75.37% | 76.88% |
| 2009 | 3.41 | 3.30 | 3.25 | 3.03 | 0.63 | 0.66 | 79.08% | 76.90% |
| 2010 | 3.70 | 3.33 | 3.34 | 3.04 | 0.60 | 0.66 | 74.61% | 76.92% |
| 2011 | 3.30 | 3.35 | 2.95 | 3.05 | 0.67 | 0.65 | 82.08% | 76.94% |
| 2012 | 2.84 | 3.38 | 2.66 | 3.06 | 0.70 | 0.65 | 77.94% | 76.96% |
| 2013 | 3.52 | 3.41 | 3.25 | 3.07 | 0.67 | 0.65 | 76.84% | 76.97% |
| 2014 | 3.22 | 3.44 | 3.07 | 3.09 | 0.68 | 0.65 | 75.58% | 76.99% |
| 2015 | 3.69 | 3.46 | 3.29 | 3.10 | 0.64 | 0.64 | 79.10% | 77.01% |
| 2016 | 2.65 | 3.33 | 2.62 | 3.11 | 0.67 | 0.64 | 79.32% | 77.03% |
| 2017 | 3.35 | 3.21 | 3.20 | 3.13 | 0.63 | 0.64 | 80.01% | 77.05% |
| 2018 | 3.39 | 3.09 | 3.25 | 3.14 | 0.64 | 0.64 | - | 77.06% |
| 2019 | 2.79 | 2.98 | 2.70 | 2.91 | 0.62 | 0.63 | - | 77.08% |
| 2020 | 3.24 | 2.87 | 2.96 | 2.69 | 0.63 | 0.63 | - | 77.10% |
| 2021 | 2.69 | 2.76 | 2.60 | 2.50 | 0.61 | 0.63 | - | 77.12% |
| 2022 | 2.73 | 2.66 | 2.29 | 2.31 | 0.59 | 0.63 | - | 77.14% |
| 2023 | - | - | - | - | 0.65 | 0.62 | - | - |
New cases come from SEER 12. Deaths come from U.S. Mortality.
All Races, Ages 0–19, Both Sexes. Rates are Age-Adjusted.
Modeled trend lines were calculated from the underlying rates using the Joinpoint Trend Analysis Software.
The 2020 incidence rate is displayed but not used in the fit of the trend line(s). Impact of COVID on SEER Cancer Incidence 2020 data
New cases are also referred to as incident cases in other publications. Rates of new cases are also referred to as incidence rates.
5-Year
Relative Survival
Rate of New Cases and Deaths per 100,000: The rate of new cases of childhood brain and other nervous system cancer was 2.9 per 100,000 children per year. The death rate was 0.6 per 100,000 children per year. These rates are age-adjusted and based on 2018–2022 cases and 2019–2023 deaths.
Survival Statistics
How Many People Survive 5 Years Or More after Being Diagnosed with Childhood Brain and Other Nervous System Cancer?
Relative survival is an estimate of the percentage of patients who would be expected to survive the effects of their cancer. It excludes the risk of dying from other causes. Because survival statistics are based on large groups of people, they cannot be used to predict exactly what will happen to an individual patient. No two patients are entirely alike, and treatment and responses to treatment can vary greatly.

5-Year
Relative Survival
Based on data from SEER 21 (Excluding IL) 2015–2021. Gray figures represent those who have died from childhood brain and other nervous system cancer. Green figures represent those who have survived 5 years or more.
Survival by Stage
Cancer stage at diagnosis, which refers to extent of a cancer in the body, determines treatment options and has a strong influence on the length of survival. In general, if the cancer is found only in the part of the body where it started it is localized (sometimes referred to as stage 1). If it has spread to a different part of the body, the stage is regional or distant. The earlier childhood brain and other nervous system cancer is caught, the better chance a person has of surviving five years after being diagnosed. For childhood brain and other nervous system cancer, 78.4% are diagnosed at the local stage. The 5-year relative survival for localized childhood brain and other nervous system cancer is 78.8%.
| Stage | Percent of Cases | 5-Year Relative Survival |
|---|---|---|
| Localized Confined to Primary Site |
78% | 78.8% |
| Regional Spread to Regional Lymph Nodes |
11% | 61.8% |
| Distant Cancer Has Metastasized |
5% | 51.2% |
| Unknown Unstaged |
5% | 77.3% |
SEER 21 (Excluding IL) 2015–2021, All Races, Both Sexes by SEER Combined Summary Stage
New Cases and Deaths
How Common Is This Cancer?
Compared to other childhood cancers, childhood brain and other nervous system cancer is fairly common.
| Rank | Common Types of Childhood Cancer | New Cases Per 100,000 |
Deaths Per 100,000 |
|---|---|---|---|
| 1. | Leukemia | 4.8 | 0.5 |
| 2. | Brain and Other Nervous System Cancer | 2.9 | 0.6 |
| 3. | Non-Hodgkin Lymphoma | 1.3 | 0.1 |
| 4. | Hodgkin Lymphoma | 1.2 | 0.0 |
| 5. | Testicular Cancer | 1.1 | 0.0 |
| 6. | Thyroid Cancer | 1.1 | 0.0 |
| 7. | Soft Tissue Cancer | 1.1 | 0.2 |
| 8. | Bone and Joint Cancer | 1.0 | 0.2 |
| 9. | Ovarian Cancer | 0.7 | 0.0 |
| 10. | Kidney and Renal Pelvis Cancer | 0.7 | 0.1 |
Childhood brain and other nervous system cancer represents 15.1% of all new childhood cancer cases.

15.1%
SEER 21 Incidence 2018–2022 & U.S. Mortality 2019–2023, Ages 0–19. Rates are Age-Adjusted
Who Gets This Cancer?
Childhood brain and other nervous system cancer is slightly more common in boys than girls. The rate of new cases of childhood brain and other nervous system cancer was 2.9 per 100,000 children per year based on 2018–2022 cases, age-adjusted.
Males
| All Races | 3.0 |
|---|---|
| Hispanic | 2.6 |
| Non-Hispanic American Indian/Alaska Native | Not Shown, <16 cases |
| Non-Hispanic Asian/Pacific Islander | 2.5 |
| Non-Hispanic Black | 2.5 |
| Non-Hispanic White | 3.5 |
Females
| All Races | 2.7 |
|---|---|
| Hispanic | 2.4 |
| Non-Hispanic American Indian/Alaska Native | Not Shown, <16 cases |
| Non-Hispanic Asian/Pacific Islander | 2.3 |
| Non-Hispanic Black | 2.3 |
| Non-Hispanic White | 3.2 |


SEER 21 2018–2022, Age-Adjusted
| Age Range | Percent of New Cases |
|---|---|
| <1 | 5.1% |
| 1–4 | 25.1% |
| 5–9 | 27.6% |
| 10–14 | 24.0% |
| 15–19 | 18.2% |
Childhood brain and other nervous system cancer is most frequently diagnosed among children aged 5–9.
Median Age
At Diagnosis
SEER 21 2018–2022, All Races, Both Sexes
Who Dies From This Cancer?
Brain and other nervous system cancer is the leading cause of childhood cancer death in the United States. The death rate was 0.6 per 100,000 children per year based on 2019–2023 deaths, age-adjusted.
Males
| All Races | 0.6 |
|---|---|
| Hispanic | 0.6 |
| Non-Hispanic American Indian/Alaska Native | Not Shown, <16 cases |
| Non-Hispanic Asian/Pacific Islander | 0.6 |
| Non-Hispanic Black | 0.6 |
| Non-Hispanic White | 0.7 |
Females
| All Races | 0.6 |
|---|---|
| Hispanic | 0.5 |
| Non-Hispanic American Indian/Alaska Native | Not Shown, <16 cases |
| Non-Hispanic Asian/Pacific Islander | 0.6 |
| Non-Hispanic Black | 0.7 |
| Non-Hispanic White | 0.6 |
U.S. 2019–2023, Age-Adjusted
| Age Range | Percent of Deaths |
|---|---|
| <1 | 2.3% |
| 1–4 | 13.1% |
| 5–9 | 33.5% |
| 10–14 | 26.7% |
| 15–19 | 24.5% |
The percent of childhood brain and other nervous system cancer deaths is highest among children aged 5–9.
Median Age
At Death
U.S. 2019–2023, All Races, Both Sexes
Trends in Rates
Changes Over Time
Keeping track of new cases, deaths, and survival over time (trends) can help scientists understand whether progress is being made and where additional research is needed to address challenges, such as improving screening or finding better treatments.
Using statistical models for analysis, age-adjusted rates for new childhood brain and other nervous system cancer cases have been falling on average 2.7% each year over 2013–2022. Age-adjusted death rates have been stable over 2014–2023. 5-year relative survival trends are shown below.
Interactive Statistics with SEER*Explorer
- Create custom graphs and tables
- Download data and images
- Share links to results
SEER*Explorer is an interactive website that provides easy access to a wide range of SEER cancer statistics. It provides detailed statistics for a cancer site by sex, race, calendar year, age, and for a selected number of cancer sites, by stage and histology.
Explore Additional Childhood Brain and Other Nervous System Cancer StatisticsMore About This Cancer
Cancer and the Brain
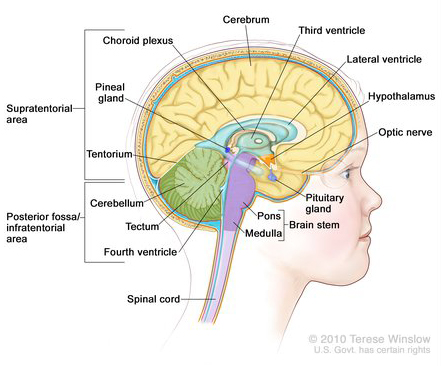
Figure: Drawing of brain anatomy showing the supratentorial area (the upper part of the brain) and the posterior fossa/infratentorial area (the lower back part of the brain). The supratentorial area contains the cerebrum, lateral ventricle, third ventricle, choroid plexus, hypothalamus, pineal gland, pituitary gland, and optic nerve. The posterior fossa/infratentorial area contains the cerebellum, tectum, fourth ventricle, and brain stem (pons and medulla). The tentorium and spinal cord are also shown.
Brain and other nervous system cancer is the second most common type of childhood cancer. Although there are many types of brain and other nervous system cancer in children, malignant pilocytic astrocytomas, medulloblastomas, and malignant gliomas make up the majority of all cases. This factsheet combines all types of childhood brain and other nervous system cancer.
Even when diagnosed with the same type of brain or nervous system tumor, symptoms and outcomes for children differ from adults.
Brain and other central nervous system cancer develops when abnormal cells form in the tissues of the brain and spinal cord. Abnormal cell growth forms tumors, which may be benign (not cancer) or malignant (cancer). Both benign and malignant brain tumors need treatment. There are many types of childhood brain and other nervous system cancer, including:
Childhood brain and other nervous system cancer is described as untreated, in remission, or recurrent.
Additional Information
More Information
Here are some resources for learning more about brain and other nervous system cancers.
References
All statistics in this report are based on statistics from SEER and the Centers for Disease Control and Prevention's National Center for Health Statistics. Most can be found within SEER*Explorer.
Suggested Citation
All material in this report is in the public domain and may be reproduced or copied without permission; citation as to source, however, is appreciated.
SEER Cancer Stat Facts: Childhood Brain and Other Nervous System Cancer. National Cancer Institute. Bethesda, MD, https://seer.cancer.gov/statfacts/html/childbrain.html
These stat facts focus on population statistics that are based on the U.S. population. Because these statistics are based on large groups of people, they cannot be used to predict exactly what will happen to an individual patient. To see tailored statistics, browse SEER*Explorer. To see statistics for a specific state, go to the State Cancer Profiles.
The statistics presented in these stat facts are based on the most recent data available, most of which can be found in SEER*Explorer. In some cases, different year spans may be used.
Estimates of new cases and deaths for 2025 are projections made by the American Cancer Society (ACS), based on earlier reported data.
Cancer is a complex topic. There is a wide range of information available. These stat facts do not address causes, symptoms, diagnosis, treatment, follow-up care, or decision making, although links are provided to information in many of these areas.