The most recent preliminary estimates of incidence rates and trends are for 2000-2017. Users should refer to the official rates for 1975-2018 in SEER*Explorer, which was released in April 2021.
Every April, the NCI releases cancer statistics based on data submitted to the NCI in November of the previous year. For example, in April 2020, cancer statistics will be based on data available as of November 2019. It can be several months between diagnosis of a case and when the cancer registry receives complete information on that case. In November 2019, information through the 2017 calendar year is considered sufficiently complete to calculate official statistics, whereas data from diagnosis year 2018 still have substantial missing information. Even with a lag time of nearly two years to increase data completeness, new cases and additional information will become available to the cancer registries in the future. A model is used to account for this delay, called the November submission delay model.
To obtain more up-to-date information on cancer trends and rates, the model was extended to model missing information from an earlier look at the data. Data from nine months earlier (February 2019, rather than November 2019) were used to determine preliminary estimates of rates and trends through the 2017 diagnosis year. The preliminary estimates presented on the Preliminary Estimates for 2017 page are based on data submitted to the NCI in February as well as the application of the February submission delay model to the data. For more information about the delay model, visit Cancer Incidence Rates Adjusted for Reporting Delay.
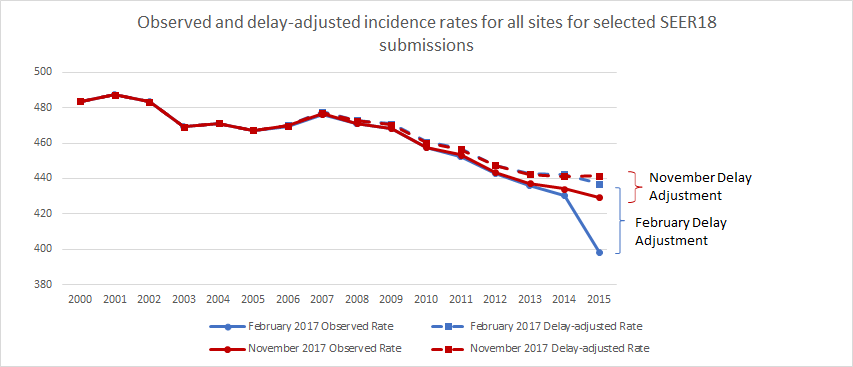
The graph below shows the effect of delay adjustment as compared with observed data for all cancer sites combined. The February 2017 delay-adjusted rate is greater than the February 2017 observed rate to make up for the undercount of cases in the February 2017 submission. The February and November delay-adjusted rates are fairly similar, even though the size of the adjustment is much larger for February. The fact that the February and November delay-adjusted rates are similar provides some validation of the February submission delay model. For more information, see Validation.